Data Explorer
Dive deeper into our forecasts and proprietary indicators with interactive charting and dashboards that can be fed directly into your workflow via an Excel Add-in or API.
Dashboard in Focus
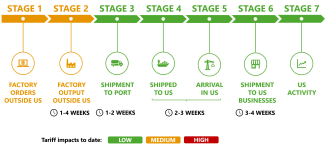
Global Trade Stress Monitor - Track the key stages of the world trade cycle in real time to identify the effects of tariffs.
Explore by Region & Country


Explore the global fracturing dashboard
Three million datapoints. 98 charts. One interactive dashboard.


8822.jpg)
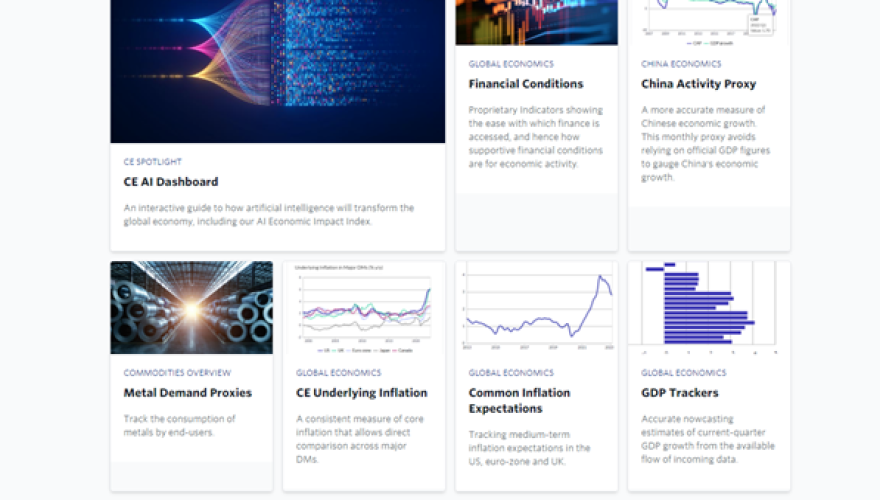
CE AI Dashboard
An interactive guide to how artificial intelligence will transform the global economy, including our AI Economic Impact Index.